

What’s the issue?
With the Biden administration’s focus on climate change, there is an expectation that the development of renewable sources of electricity will grow at a faster pace than previously anticipated.
Why does it matter?
Traditional electric generation projects using nuclear, coal or natural gas were very large projects that could be tracked individually as they progressed. By contrast, the solar industry builds a large number of much smaller nameplate capacity projects, which makes monitoring them individually both more difficult but also less relevant.
What’s our view?
LawIQ is developing a model to allow our customers to monitor the solar projects throughout the country and project the growth of solar capacity over time and by region. As we show today, the projects take, on average, about less than twenty months to complete, but capturing the variance around that average is critical to creating a model that can accurately predict the commercial operation date of a large number of projects, such as the more than 500 currently being developed around the country.
According to the projections of the U.S. Energy Information Administration (EIA), even under its 2020 base case, by 2050, renewables will be used to generate 38% of the total electricity in this country, which will be just a bit more than the 36% generated by natural gas. Solar alone will represent about 46% of the total renewable power portfolio, up from about 9% of the current renewable portfolio.
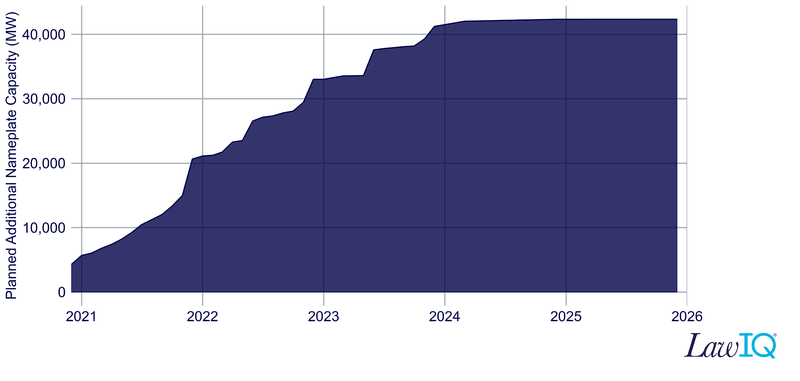
EIA data shows that over the last five years, more than three thousand solar projects have moved through the various phases of the development process across the country. In addition, there are currently over 500 such projects in various stages of development. These projects average less than 60 MW of summer nameplate capacity, but have a combined total of 42,000 MW. Based on the commercial operations date projected by the developers of these projects, the growth in capacity over the coming years looks like this.
Today we provide an overview of the development phases for these projects, our analysis of the length of time each phase typically takes, and ultimately how our projection of the future buildup of new projects compares to the current projection of the sponsors of the pending projects.
Phases of Development
There is no centralized agency that is responsible for approving these solar projects similar to how FERC does for pipeline projects. However, the projects move through phases that would be familiar to those who are used to monitoring a FERC project. Each project will typically pass through the following phases:
- Planned but permits not yet filed
- Permits filed but not yet received
- Permits received, but not yet under construction
- Under construction but not yet 50% complete
- Under construction and more than 50% complete
- Construction complete, but not yet in commercial operation
- Operating
Size of Solar Projects
Looking at the more than 3100 solar projects that have been planned over the last five years, these projects range in size from 0.1 to 690 MW of summer nameplate capacity.
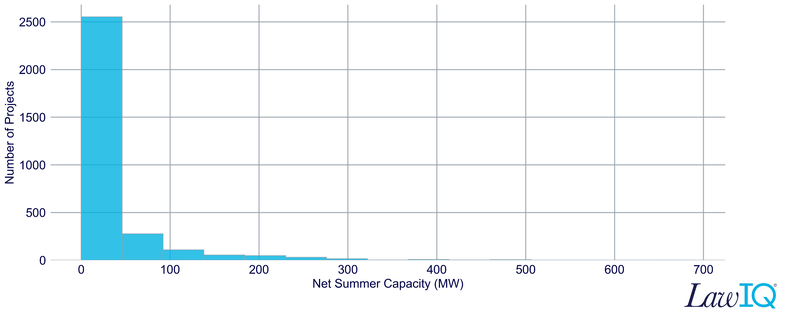
As seen above, more than 70% of the projects were less than 50 MW in size.
Time to Complete
By reviewing these projects, we can see how long the typical project spends in each of the phases described above.
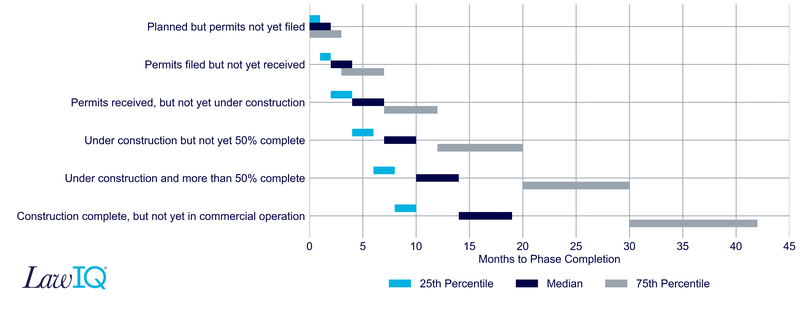
As seen above, the median time to complete all the phases is less than 20 months, but the data shows that there is substantial variability in the phase lengths among the projects, and the bottom 25% can take almost four years to move through the phases to commercial operation.
The Big Picture
By using the data from projects that have moved through these various phases, it is possible to build a model for the over 500 projects currently under development and project their monthly progress.
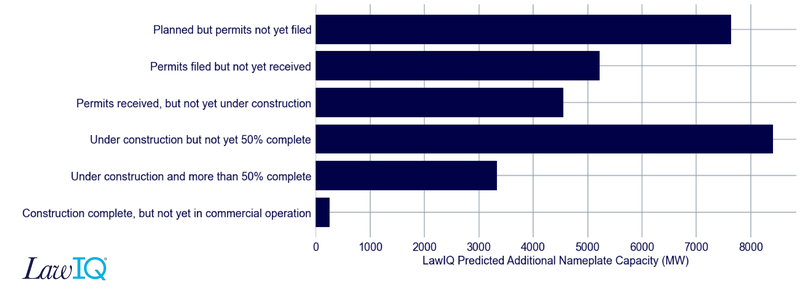
As seen above, our current projection shows that the two largest groupings of projects working their way through the process are those still in the planning phase and those for which construction has started, but the project is not yet 50% complete.
Using the timelines set forth above, we can model the anticipated commercial operation date for projects under development and compare it to the projections of the project sponsors.
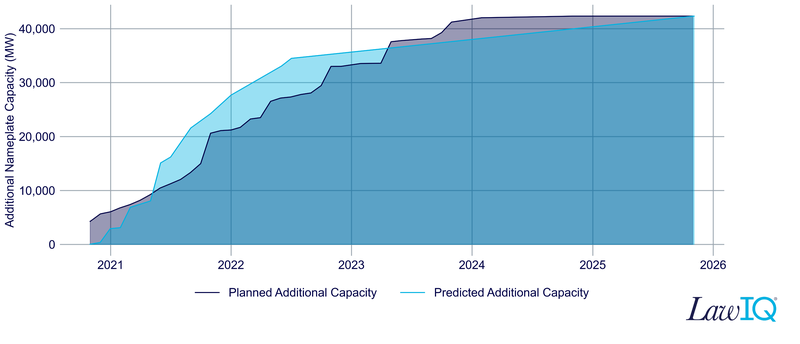
As seen above, the sponsors and our model are in general agreement as to overall timing, but this will likely change as each of the projects progress through the various stages.